The Dashboard is the first screen you see when you log in to the Admin Portal. It is configurable and user-specific so any changes you make will not affect other users Dashboard views and your layout will be as you last configured it when you next access it.
The Dashboard will be empty until you add your own tabs and graphs.
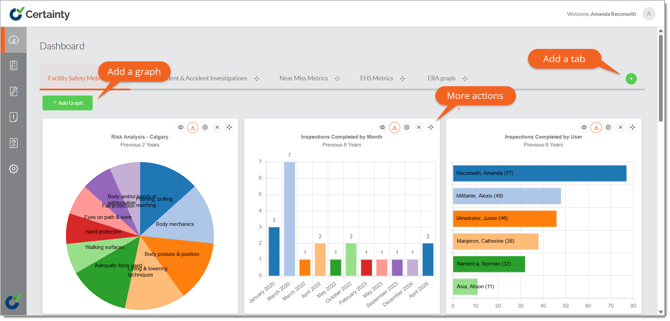
How do I add tabs to my Dashboard?
To add a tab to your Dashboard:
- Click on the green ‘Add’ button to open the ‘Add tab’ form.
- Give your tab a name.
- Click ‘Save’.
How do I add graphs to my Dashboard?
To add a graph to your Dashboard:
- Select or add a tab.
- Click on the green ‘Add graph’ button to open the ‘Add graph’ form.
- Choose the graph you would like on your dashboard.
- Decide on settings and layout.
- Click ‘Save’.
Notes:
- You can open graphs to view more details, download graphs to different formats, edit the graph settings, delete and move graphs around using the icons in the top right corner.
- You can change the size of a graph by dragging the double arrow in the bottom right corner.
- Your dashboard will only contain information from sites you have been given access to.
Learn this next...
How do I configure KPI graphs on my Dashboard in the Admin Portal?