Business Intelligence (Power BI) can be found in the ‘Reports’ area.
Power BI is a business analytics service by Microsoft and one of the most powerful tools of its kind. Through integration of Power BI with Certainty Software you can view customizable dashboard graphics and uniquely visualized data analytics.
Power BI – Layout & Pages
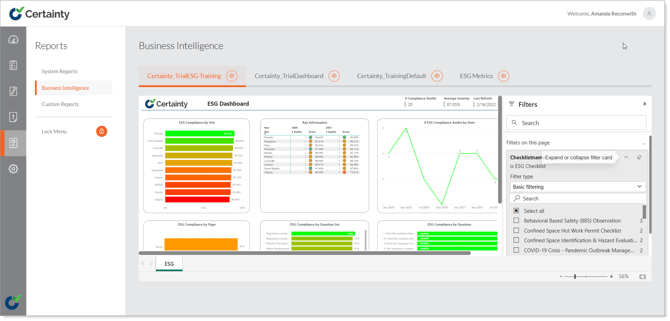
Once in the Business Intelligence tab you’ll see the Power BI dashboard.
-
The data displayed in this dashboard is linked through a Power BI “Gateway” and the SQL server for your instance of Certainty.
-
Displayed here is the dashboard we’ve set up as the default for all instances of Certainty. There are several Pages that can be clicked through on the bottom left corner of the dashboard.
-
With an Office 365 Microsoft Power BI Pro License, you can download the Power BI desktop application and create custom visualizations and pages yourself, or they can be created by us through our Professional Services.
Power BI - Filters
To the right of the Power BI Dashboard is an expandable tab called Filters.
-
The filters located in this tab are used to segregate the data presented through the dashboard.
-
There are two types of filters, Report level filters and Page level filters.
-
Changing the parameters on a Report level filter will affect the information being displayed across all pages on the dashboard, while Page level filter will only affect the current page.
-
There are several Report and Page level filters that can be applied to your Power BI dashboard. Some filters, like 'Date', have options to filter by a specific date range, or within the last X weeks, months, etc.